With ‘Digital Twins,’ The Doctor Will See You Now
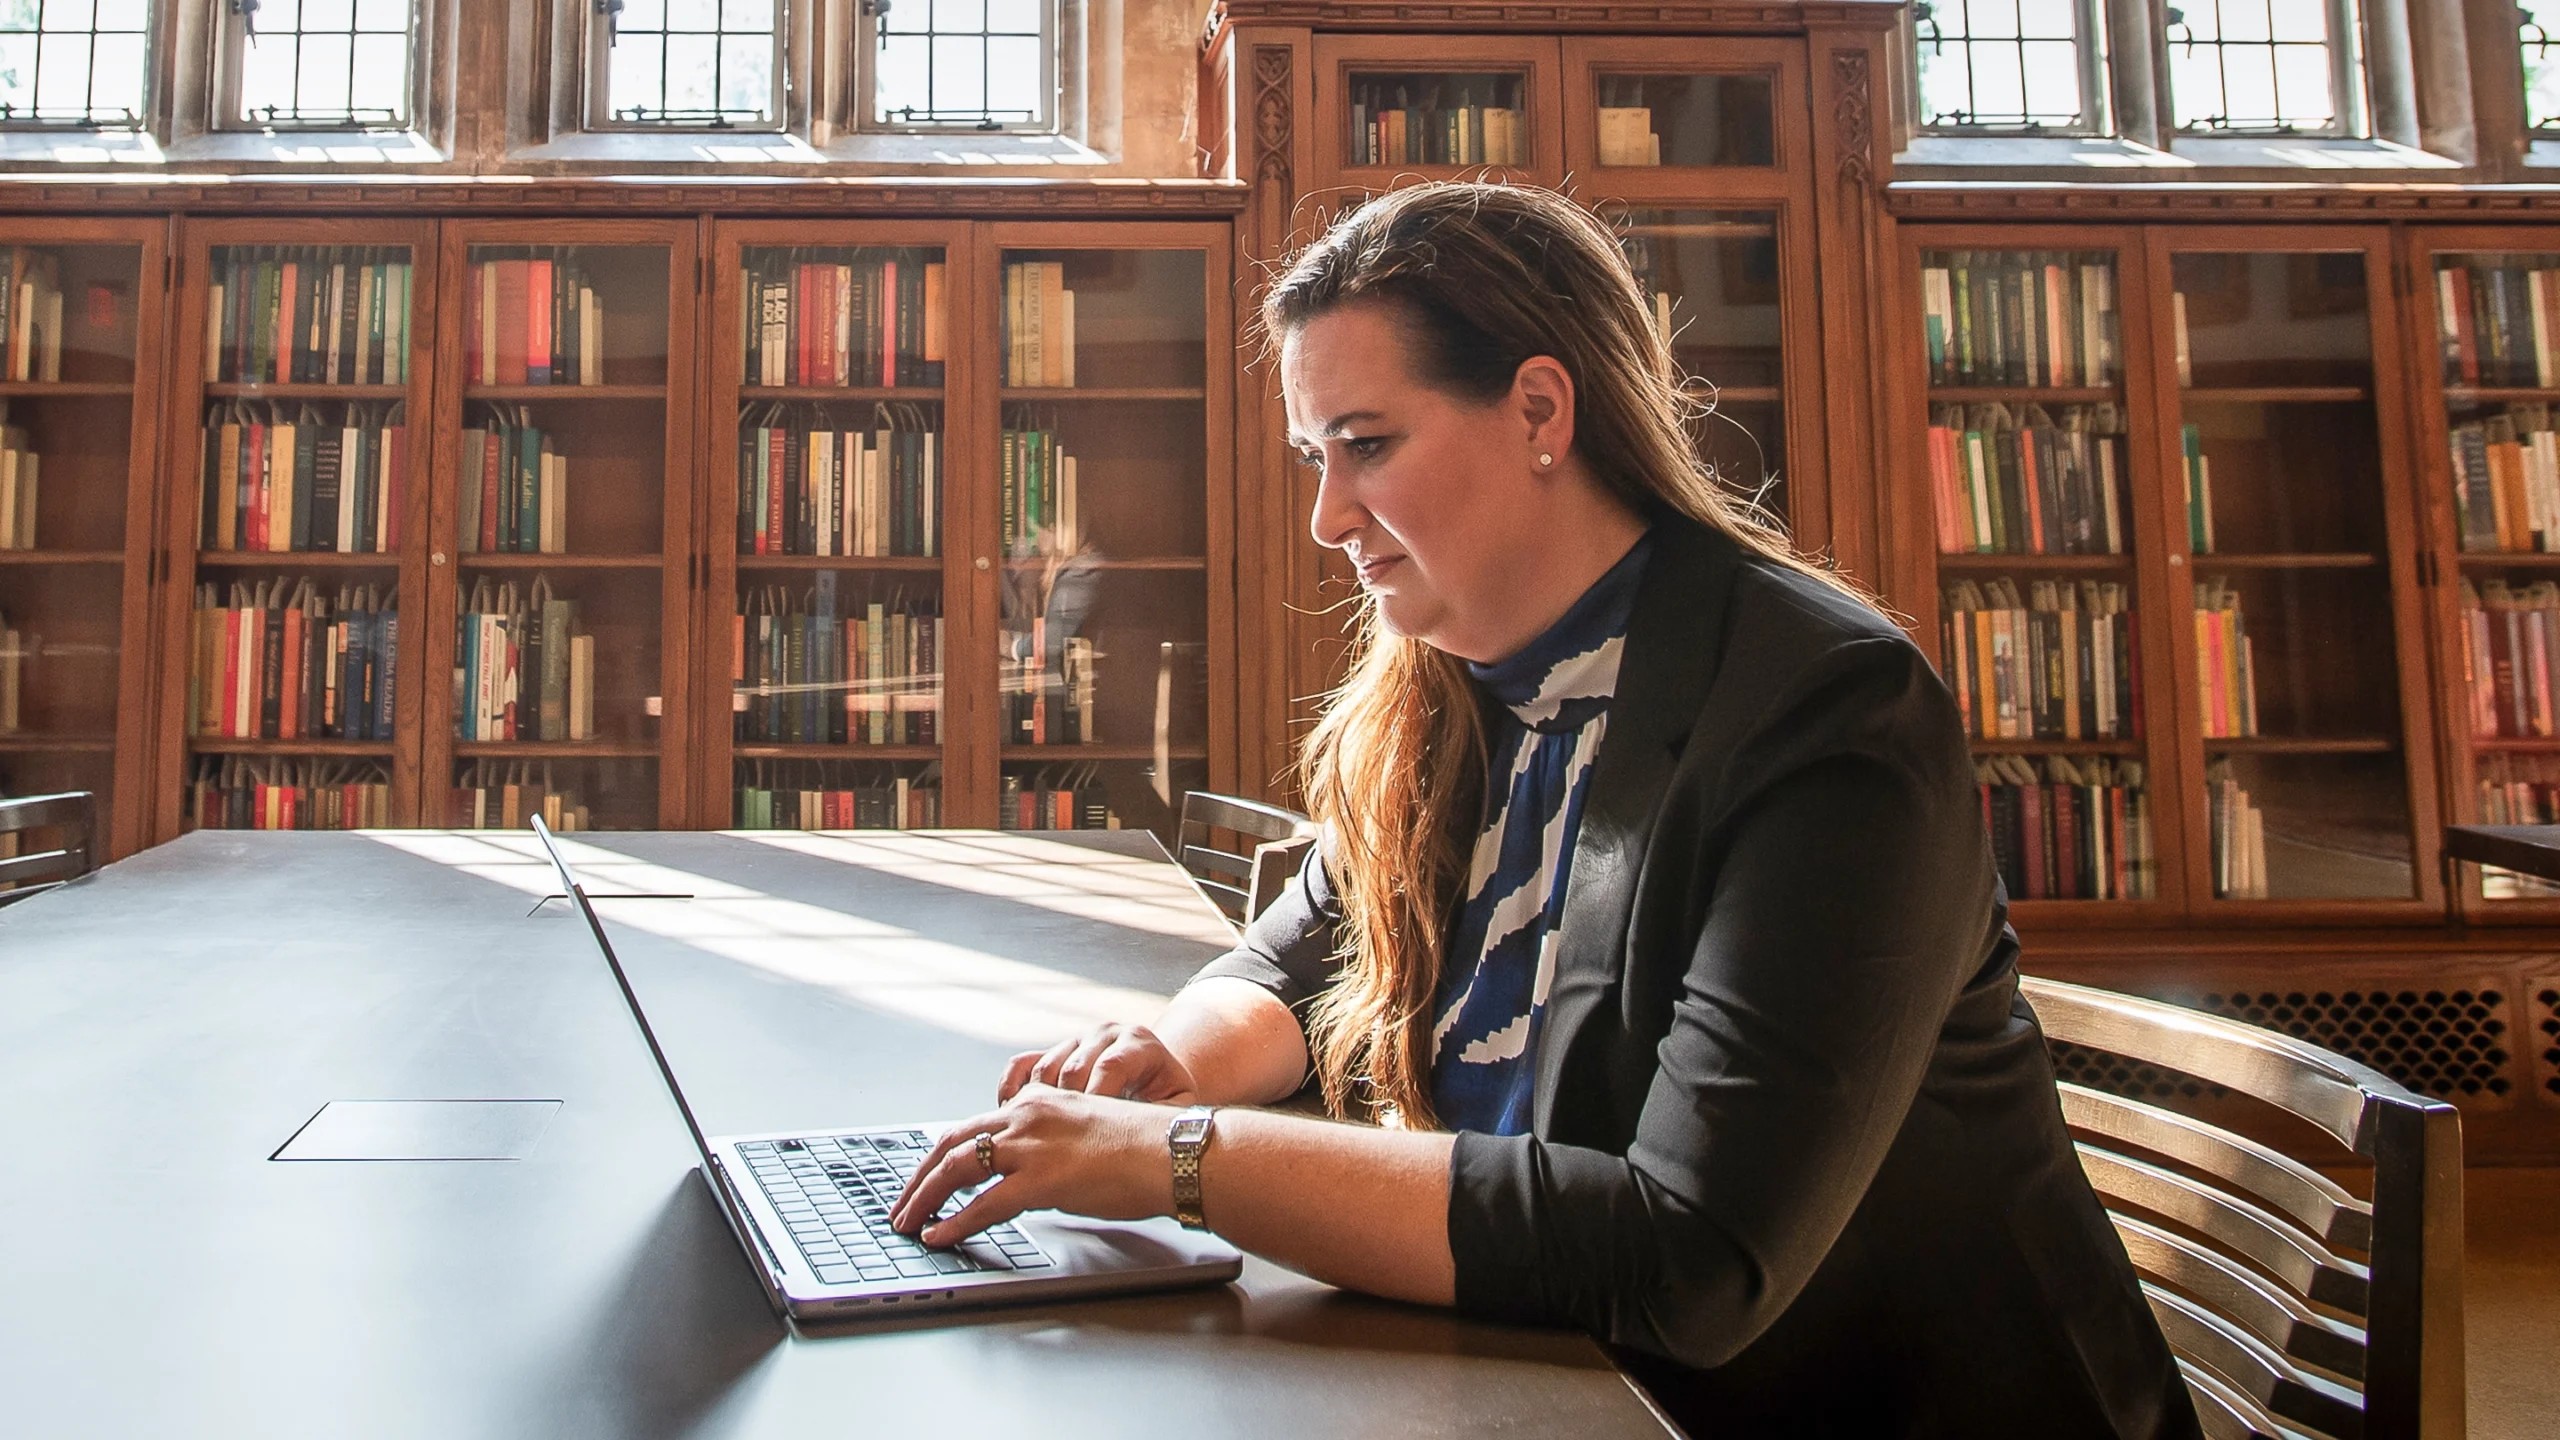
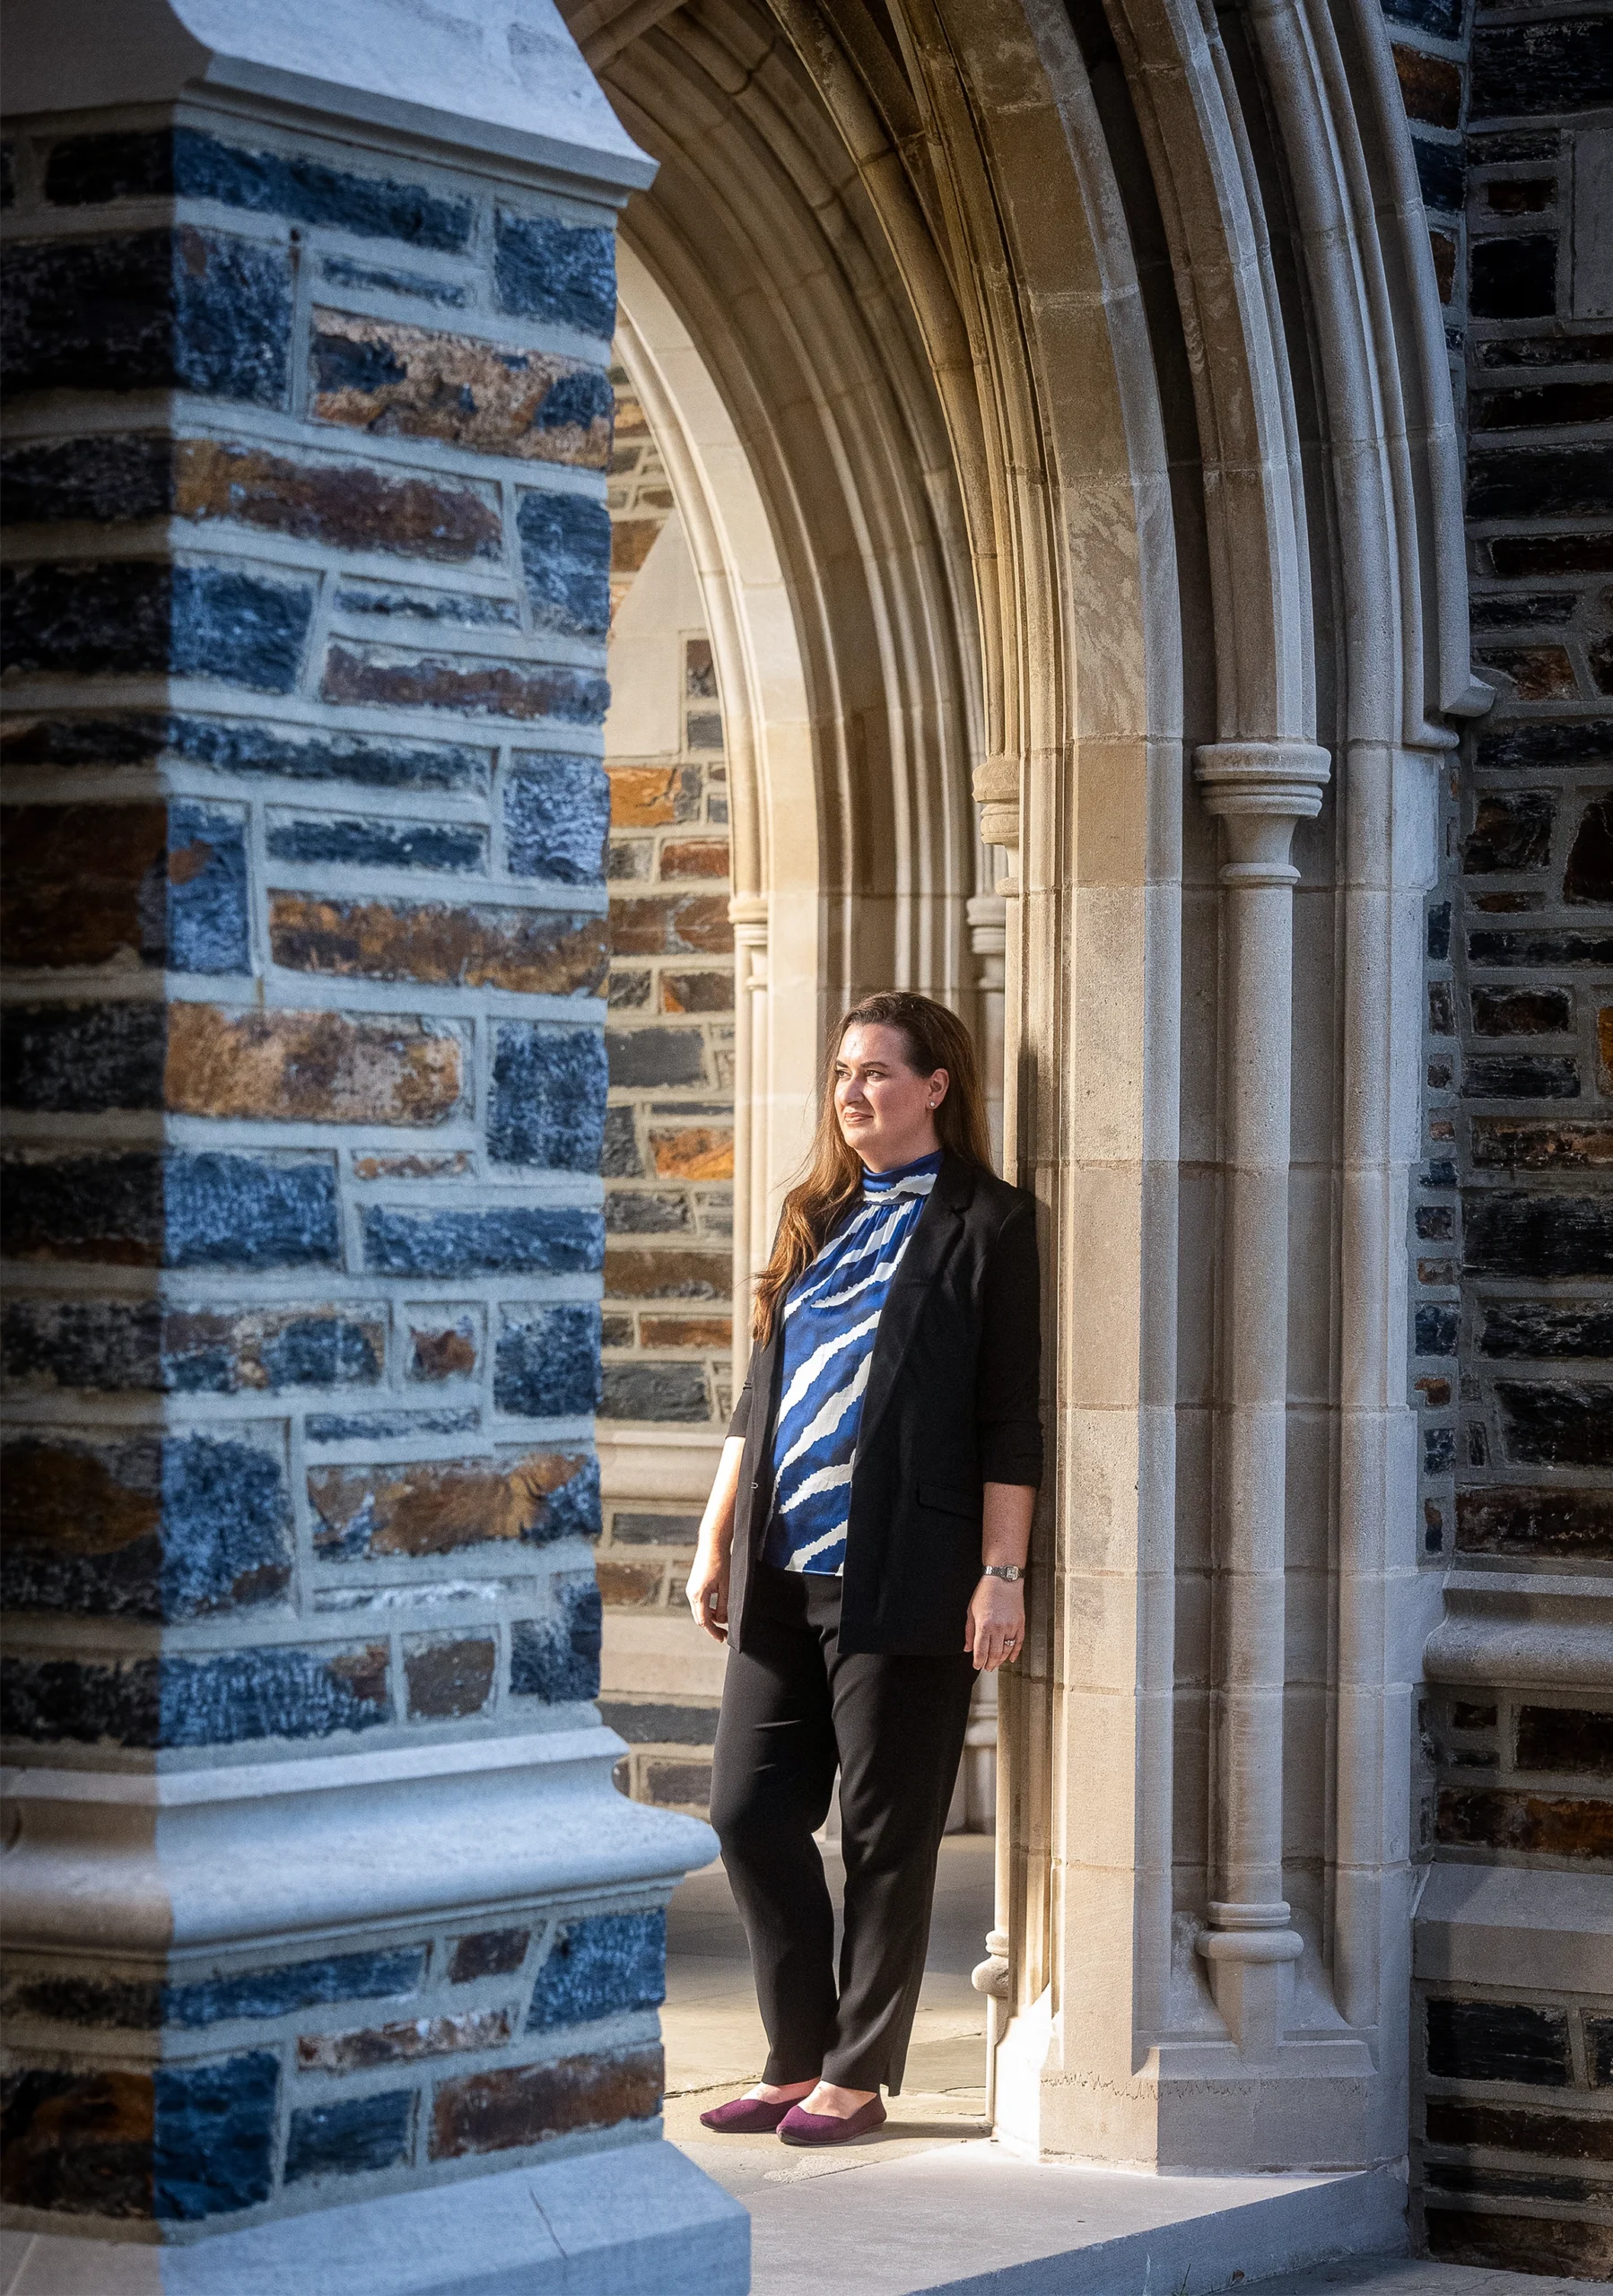
From a young age, Randles wanted to combine computing with health research.
Kate Medley for Quanta Magazine
Introduction
Amanda Randles wants to copy your body. If the computer scientist had her way, she’d have enough data — and processing power — to effectively clone you on her computer, run the clock forward, and see what your coronary arteries or red blood cells might do in a week. Fully personalized medical simulations, or “digital twins,” are still beyond our abilities, but Randles has pioneered computer models of blood flow over long durations that are already helping doctors noninvasively diagnose and treat diseases.
As a teen in 1990s Michigan, Randles already imagined a career that blended coding and biology. After graduating from Duke University with a physics and computer science degree, she tinkered with Blue Gene supercomputers during a three-year stint at IBM. She then went on to get her doctorate in applied physics at Harvard University. While there, she built a blood circulation model named Harvey that she eventually moved to her own digital-twin lab at Duke. In April, she won the Association for Computing Machinery Prize in Computing — and $250,000 — for her groundbreaking research.
Her latest system takes 3D images of a patient’s blood vessels, then simulates and forecasts their expected fluid dynamics. Doctors who use the system can not only measure the usual stuff, like pulse and blood pressure, but also spy on the blood’s behavior inside the vessel. This lets them observe swirls in the bloodstream called vortices and the stresses felt by vessel walls — both of which are linked to heart disease. A decade ago, Randles’ team could simulate blood flow for only about 30 heartbeats, but today they can foresee over 700,000 heartbeats (about a week’s worth). And because their models are interactive, doctors can also predict what will happen if they take measures such as prescribing medicine or implanting a stent.
Quanta spoke with Randles about the pros and cons of too much data, how graphics can help bridge biology and computation, and the looming impact of machine learning. The interview has been condensed and edited for clarity.
Harvey, the blood circulation model Randles created, can predict the fluid dynamics of blood flow in an individual for over 700,000 heartbeats.
Kate Medley for Quanta Magazine
When did you first imagine computing could help doctors treat patients?
I went to a math and science center for high school. We were learning biology and the sciences alongside computer programming, so there was a lot of crossover. Then I worked in a genetics lab in early sophomore year of college, where they were using a lot of computation to do patient-specific genome analysis and other cell technologies.
Is that when you got interested in supercomputers?
I don’t even know how to say this, but — I didn’t know what a supercomputer was when I joined IBM. I just knew they were using computing for bio. I didn’t really understand what it meant to be a supercomputer. I had been interviewing for an operating systems job in Texas, and then they called and said, “We have an opening in Minnesota on the IBM Blue Gene supercomputer team.” I was really lucky to get put on that team.
What made you realize that circulation models could work?
Our 2010 paper was the first to capture the entire coronary tree — that is, all of your coronary arteries — for the duration of a heartbeat at cellular resolution. That paper used MUPHY, a predecessor to Harvey. Seeing a 2D or 3D simulation with the right geometry was really rewarding.
When we needed to make some changes, we moved to the one I wrote from scratch on my own. The first time I was able to see an artery and blood flow on Harvey, I remember saying to someone in the lab, “I have a picture!”
Why is the picture so important?
I had a co-adviser, Hanspeter Pfister, who was a graphics expert. We brought in people from his team who were interning at places like Disney and Pixar. We drew a lot from the way they were already optimizing graphics for these computers: The 3D mesh file that we create of the arteries is really similar to what they make for animated characters. The way you move a character’s arm and deform that mesh is the same way you would put in a virtual stent.
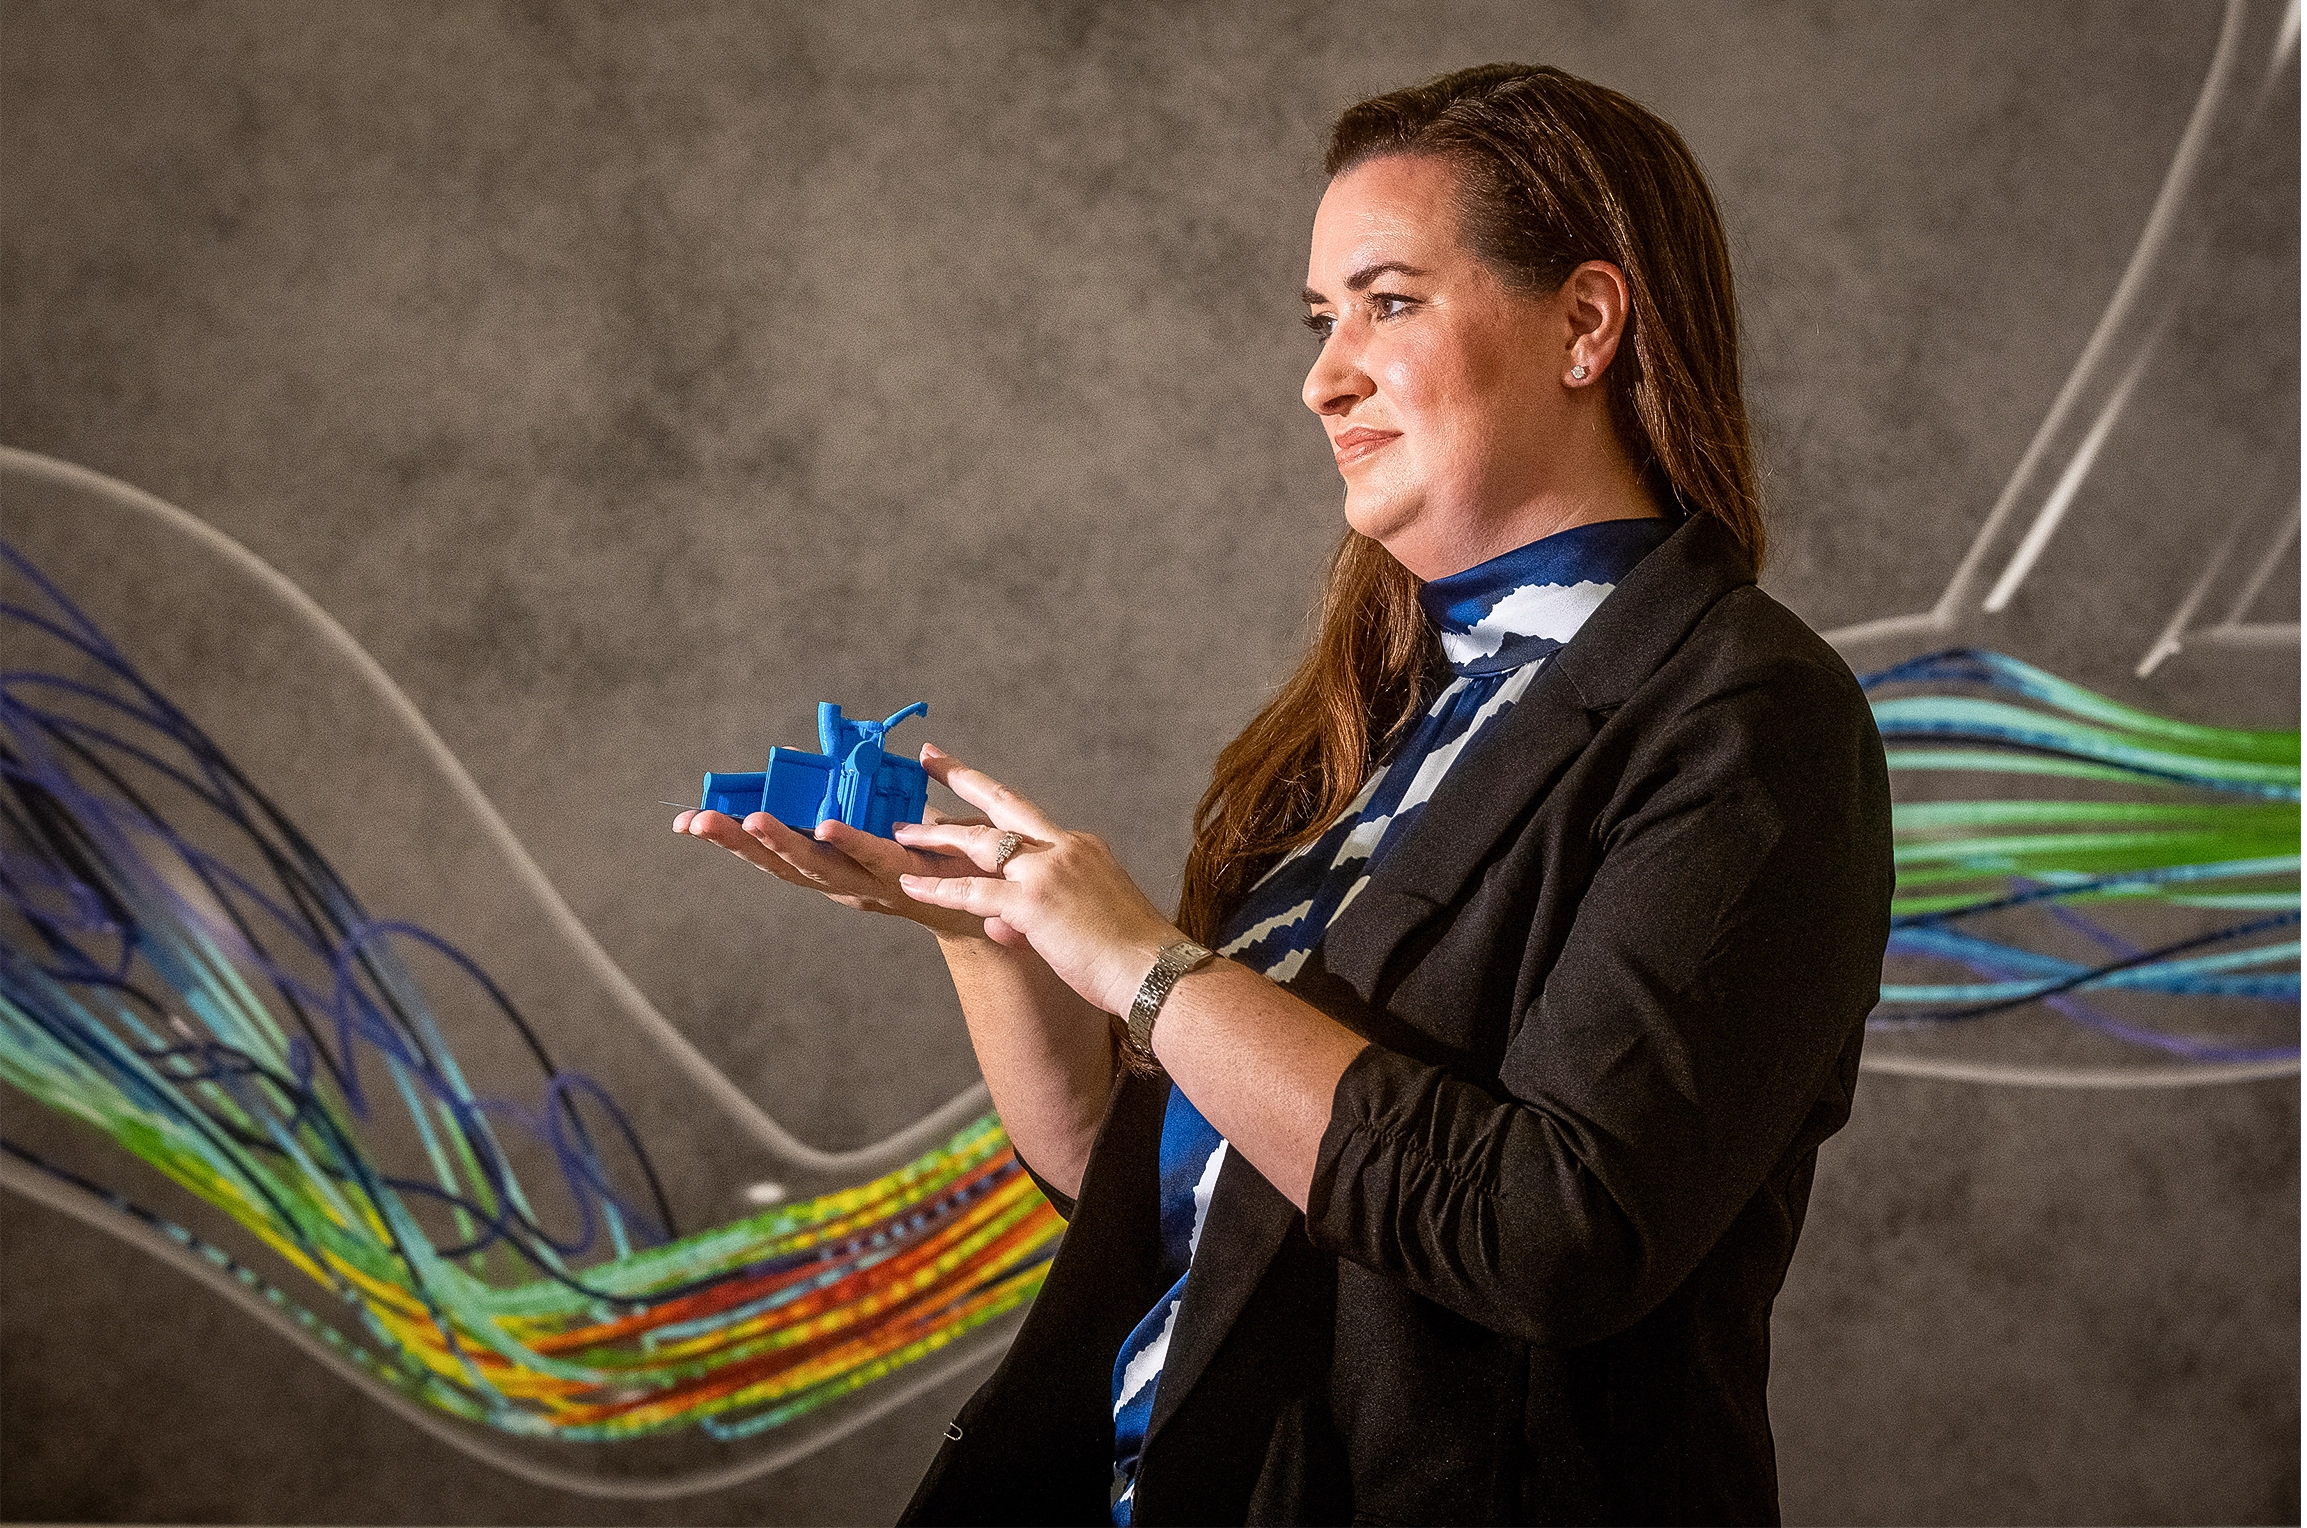
Randles holds a 3D printed heart from a pediatric patient while standing in front of a simulation of blood flow.
Kate Medley for Quanta Magazine
And the predictions are not just a single number that you want to get back. There’s a quantity called “wall shear stress,” which is just a frictional force on the wall. We’ve shown that when doctors can visualize that wall shear stress at different parts of the artery, they may actually change the length of the stent that they choose. It really informs their decisions.
We’ve also shown that, in borderline cases, vorticity is associated with long-term adverse effects. So doctors can see where there’s high vorticity. It could help doctors decide what type of intervention is needed, like a stent or a drug.
What else does Harvey do differently?
We wanted a code where we could test different physics models, scale to model flow on the order of the full body, capture complex cell behavior and integrate well with virtual reality interfaces for virtual surgery. MUPHY was not looking at blood flow in the whole body. We were trying to broaden it out.
Also, MUPHY was written by Italians. So many comments were in Italian, and I couldn’t understand them. [Laughs.]
How did you know if these predictions were actually accurate?
In a 160-patient study, we showed that Harvey can accurately match measurements in the patient. The standard of care is to put a guide wire directly in the artery to measure pressure before and after any narrowing — the ratio of those two numbers is called “fractional flow reserve.” We used the simulation to calculate the same thing, noninvasively.
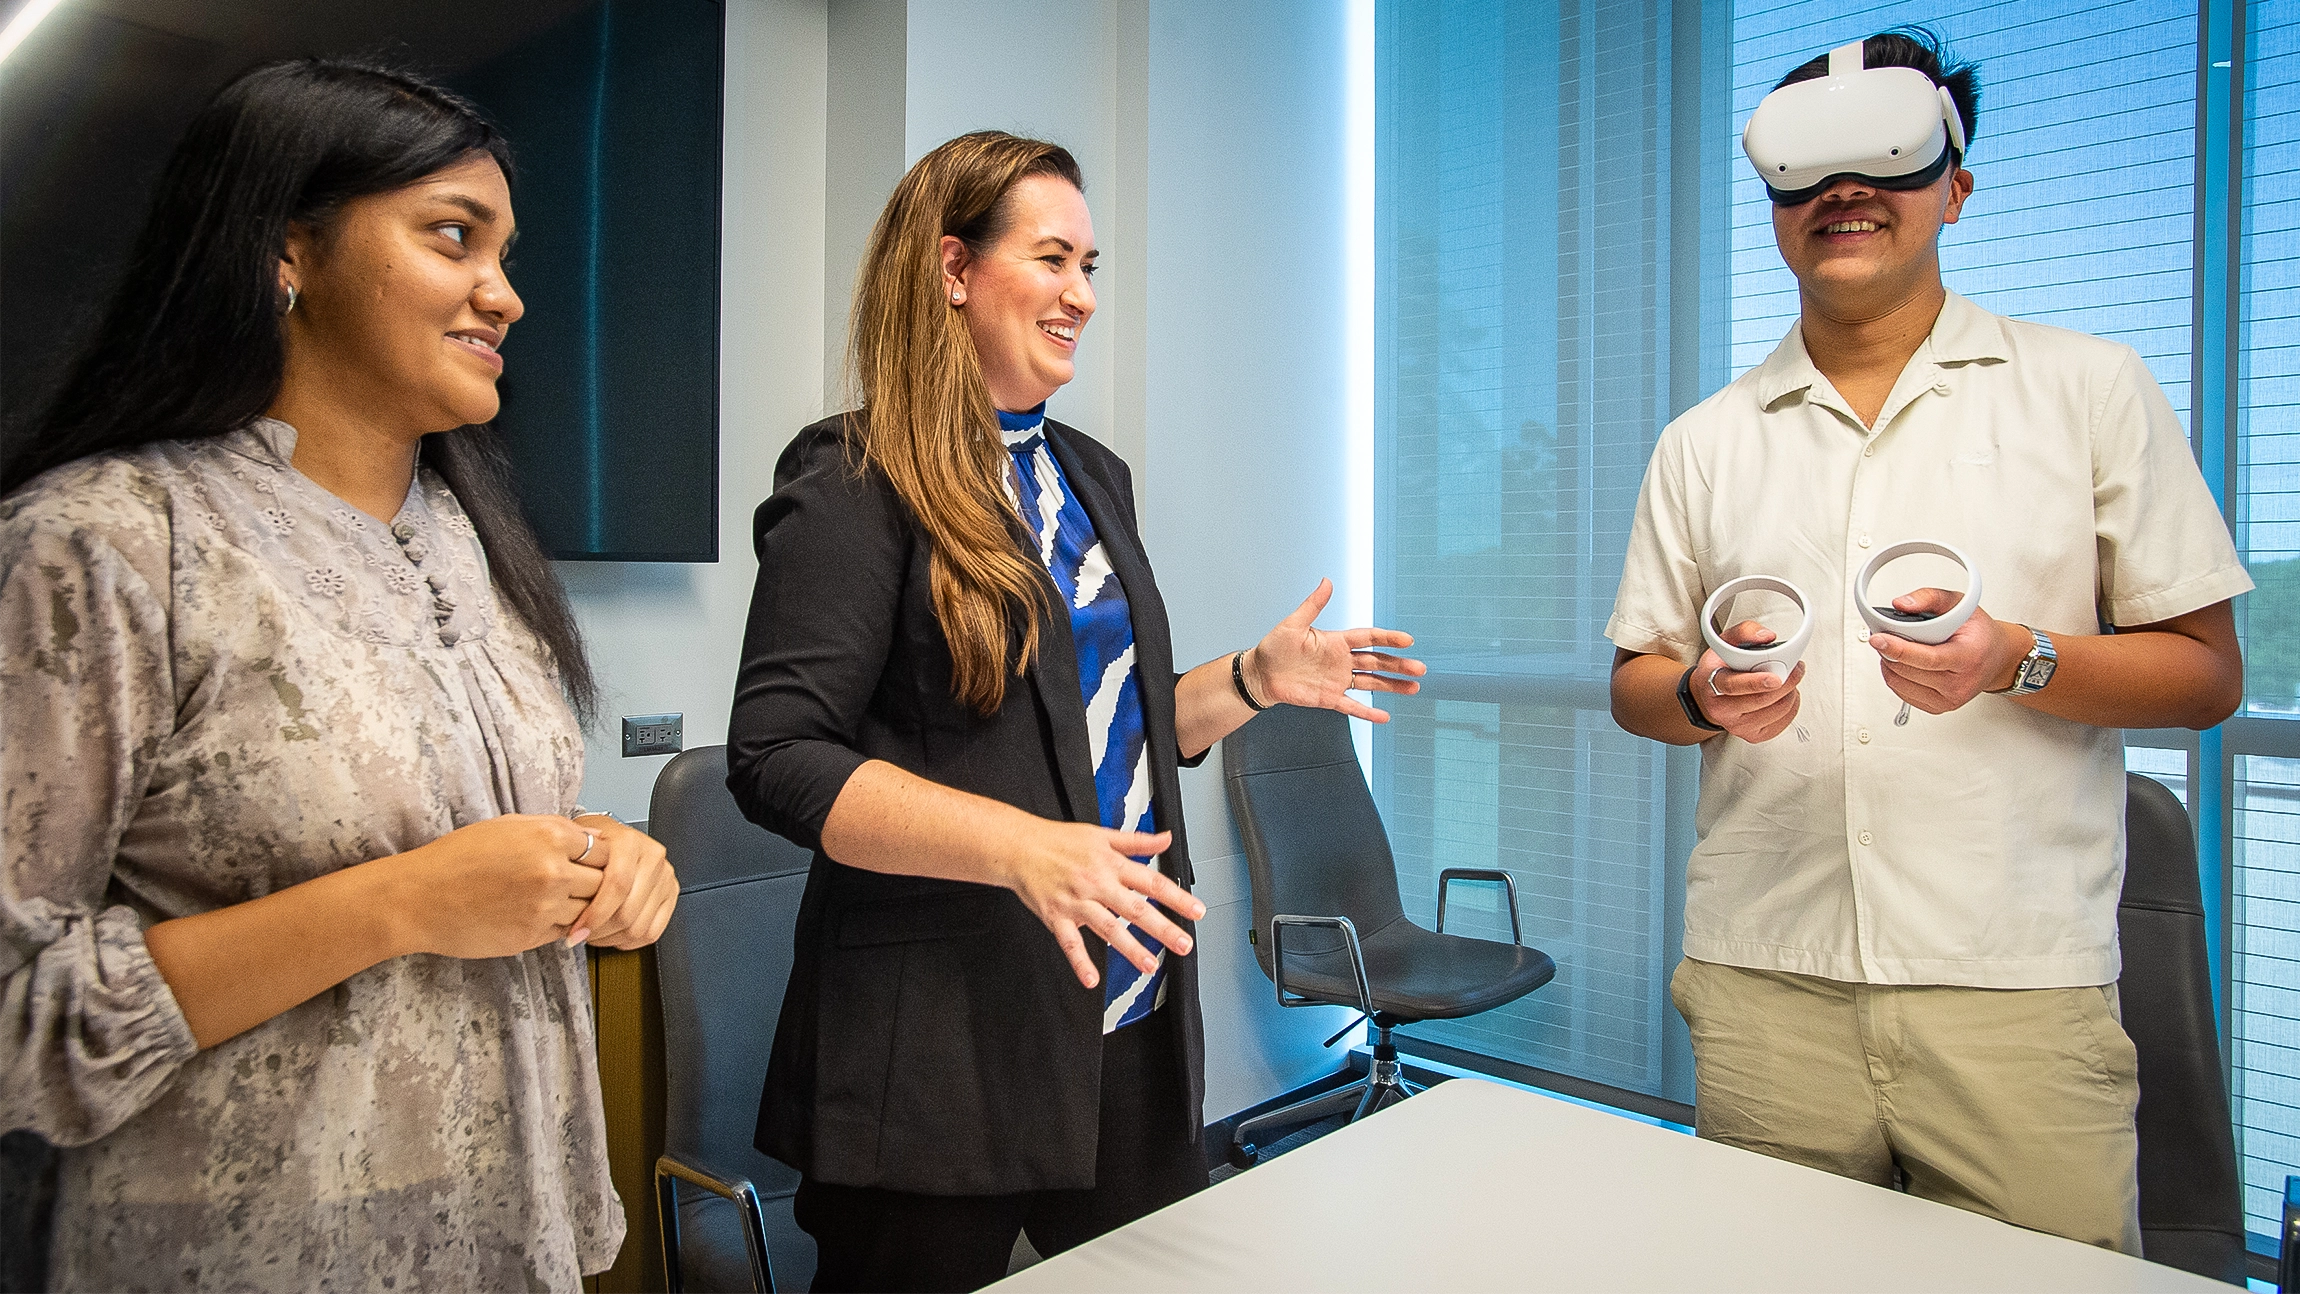
Randles helps a student virtually explore a patient’s blood vessels.
Kate Medley for Quanta Magazine
But this need for visuals makes things computationally harder, right?
Yes, a big pain for us right now is the level of data. It’s a lot of data. We’re running simulations with up to 580 million red blood cells. There’s interactions with the fluid and red blood cells, the cells with each other, the cells with the walls — you’re trying to capture all of that. For each model, one time point might be half a terabyte, and there are millions of time steps in each heartbeat. It’s really computationally intense.
Your team has tried to reduce the computational demands using machine learning tools. How has that gone?
We had a recent paper about a system that takes about 10 minutes to train the new model with flow simulations for each patient. You can then use machine learning to predict, for example, if you change the degree of the stenosis (which is how much an artery narrows), what would the overall blood pressure become? The current FDA-approved tools take about 24 hours to train for that patient. Here, you can get real-time interaction while the patient might still be in the clinic.
What’s behind this big leap?
It’s the combination of machine learning with a smaller physics-based model. We figured out how many surgical treatment options we need to simulate for each patient’s training to provide real-time predictions. We’re using one-dimensional models instead of relying on 3D for the machine learning training. It’s just calculating along the blood vessel’s centerline — that captures a 3D structure but not the full x-, y-, z-coordinates of flow. It’s smaller data, so it’s faster to train. And you can use different algorithms from machine learning so it’s faster to run.
That improvement must come at a cost. What do you give up with machine learning?
We always want things to be interpretable, especially when it’s going into the clinic. We want to ensure that doctors know why they’re making a decision and can interpret what factors influenced that prediction. You lose some of that when it turns into a black box. Right now, a lot of our work tries to understand uncertainty. How accurate does a sensor have to be to lead to a change in your blood-flow simulation?

Randles’ modeling software means doctors can analyze each patient’s unique layout of blood vessels. “Geometry is really different between people,” she said.
Kate Medley for Quanta Magazine
Then there’s just the potential for bias that you have to be aware of, especially with wearable sensors. A lot of the data may come from more affluent areas. If you’re only training on Apple Watch data, are you getting the right population mix? It’d be great to have a large population set of different ages, different genders, different activity levels, different comorbidities.
What could you do with all that data?
With up-to-date medical images for the 3D model and continuous, dynamic, high-resolution sensor data, we could figure out, for example: If you had a heart attack when you were 65, did something happen at 63? Are there ways we could have been more proactive and identified some nuance in the blood flow?
Geometry is really different between people. You need a ton of data to be able to figure out what the small difference in the blood flow is and why it would matter.
What are the limits of simulating health like this?
I don’t think there’s necessarily limits — just a lot of challenges. There’s so much that we could tie in, like the nervous system and lymphatics. We want to integrate data from many different systems, but having them talk to each other in feedback loops is really complicated. I think we’ll get there. It will just be about adding one system at a time.